
- Joined
- Feb 22, 2019
- Messages
- 229
- Reaction score
- 148
- Age
- 57
I wanted to introduce myself and an open-source mapping tool chain I have been working on. My name is Curt Olson. I've been involved in UAV's and avionics development since the mid-2000's and have been experimenting with image stitching and mapping for about 5 years now. My degree is in computer science, but right now I'm working for the U of MN UAS Lab and pretending to be an aerospace engineer.
In support of a couple different projects that have come through our lab, we have been developing an open-source image stitching/mapping solution. Our tool chain is written entirely in python + opencv. We hope this makes the code more accessible for folks that like to poke under the hood. We also hope it makes the code extensible for people that would like to do something similar, but no existing solutions quite do what you want. As a research lab, we continually bump into the limitations of commercial tools with respect to our projects and use cases, so we really like building solutions on top of open-source software, and we try to keep things simple and accessible when we can.
You can find the entire git repository with some sample data sets here: UASLab/ImageAnalysis
I put together a long rambling youtube video that shows the stitched results and details here:
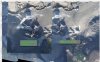
I also want to say briefly why we built our own software and/or what makes it different from other solutions. One of our current projects is essentially searching for needles in the haystack. We are surveying heavily wooded areas (often with steep inaccessible terrain) for an invasive vine called oriental bittersweet. Oriental bittersweet will eventually take over whole stands of trees, kill them, and leave a big tangled mess of vines. It can be very difficult to eradicate. We found that in the winter, we can actually spot the brightly colored berries which generally stay attached to the vines well into February. Identifying oriental bittersweet requires highly detailed low level imagery. We found that commercial tool chains always give up some resolution to make the ortho-mosaic. We also have found that when identifying small things in the map, having access to all the original full res images, all the views & angles can help immensely deciding if something is or isn't the thing we are looking for. So the end result of our software is a mapping tool that let's you view the original images (and have access to view image that covers your center of view).
This toolset isn't intended to compete directly with tools that produce dense meshes and highly detailed DEM's ... I'll leave that to the experts. We produce a 3d surface model of the area, but it is for the purpose of projecting whole images onto the surface, not building a full 3d model of every pixel in the survey area (again I'll leave that up to the experts and the tools that already do that really well.) So why would you be interested in this package?
The data sets include all the full original imagery (so they are huge!) but this is exactly the point, the visualizer is letting you hunt through the full original image set (placed and stretched and aligned with each other) with no lost detail.
If you are someone that wants to try processing a set of your own images, you probably should contact me. Currently the tool chain expects a CSV file with one line per image that gives the image name, the lon, lat, alt, as well as the roll, pitch, yaw of the aircraft at the time the image was taken. We are setup to do this easily with our own in-house autopilot and camera system, but we might need to build a small bit of glue code to create this file for images collected on other systems.
I'm posting here because I'd love to get some feed back, comments, questions, or maybe just confused looks? If there are a few brave souls interested in trying out the software that would also be cool. I'd love to connect up with other people interested in the nuts and bolts of image stitching tool chains. I really haven't any places where people are talking shop so to speak. Most people are either so far out ahead of me I can't understand what they are talking about, or they are doing this commercially and need to protect their own interests. I just wanted to say hi (so "Hi!") and say here's a thing I've been working on which is useful for us, so might be useful for someone else too?
Thanks,
Curt (U of MN UAS Lab)
In support of a couple different projects that have come through our lab, we have been developing an open-source image stitching/mapping solution. Our tool chain is written entirely in python + opencv. We hope this makes the code more accessible for folks that like to poke under the hood. We also hope it makes the code extensible for people that would like to do something similar, but no existing solutions quite do what you want. As a research lab, we continually bump into the limitations of commercial tools with respect to our projects and use cases, so we really like building solutions on top of open-source software, and we try to keep things simple and accessible when we can.
You can find the entire git repository with some sample data sets here: UASLab/ImageAnalysis
I put together a long rambling youtube video that shows the stitched results and details here:
I also want to say briefly why we built our own software and/or what makes it different from other solutions. One of our current projects is essentially searching for needles in the haystack. We are surveying heavily wooded areas (often with steep inaccessible terrain) for an invasive vine called oriental bittersweet. Oriental bittersweet will eventually take over whole stands of trees, kill them, and leave a big tangled mess of vines. It can be very difficult to eradicate. We found that in the winter, we can actually spot the brightly colored berries which generally stay attached to the vines well into February. Identifying oriental bittersweet requires highly detailed low level imagery. We found that commercial tool chains always give up some resolution to make the ortho-mosaic. We also have found that when identifying small things in the map, having access to all the original full res images, all the views & angles can help immensely deciding if something is or isn't the thing we are looking for. So the end result of our software is a mapping tool that let's you view the original images (and have access to view image that covers your center of view).
This toolset isn't intended to compete directly with tools that produce dense meshes and highly detailed DEM's ... I'll leave that to the experts. We produce a 3d surface model of the area, but it is for the purpose of projecting whole images onto the surface, not building a full 3d model of every pixel in the survey area (again I'll leave that up to the experts and the tools that already do that really well.) So why would you be interested in this package?
- It is another (legit hopefully) open-source mapping solution, so it doesn't cost money to download and use.
- Your data is your data. It is kept on your hard drive and you decide who to share it with. (I generally trust cloud solutions, but we had to sign an agreement giving drone deploy access to all our data sets to use for their own purposes in order to get an educational license from them. I think pix4d had similar terms.)
- It is written entirely in python + opencv (for anyone who likes python.)
- It is designed to hunt for needles in your haystacks. The map viewer tool shows the original images as 3d textures stretched [almost] perfectly over the ground surface. This is why it needs to be a local app on your PC, as far as I know the same thing can't be done in a web-based viewer. You aren't looking at the original images with no lost resolution. The map viewer can apply different enhancement filters (i.e. level equalization & color equalization) to help the details pop out for a human viewer (or help save poorly exposed images.) In the future it could be possible to connect this up with machine vision algorithms or additional custom-use-case filters. The viewer also makes all the images that cover your center of view available to look at.
- The software is written in a guts-out research lab style. (In my opinion that's a feature)
") This makes it slightly harder for casual users than polished commercial tools, but it also let's you see the process and tune the processing pipeline as you go to achieve better results.
This makes it slightly harder for casual users than polished commercial tools, but it also let's you see the process and tune the processing pipeline as you go to achieve better results.
The data sets include all the full original imagery (so they are huge!) but this is exactly the point, the visualizer is letting you hunt through the full original image set (placed and stretched and aligned with each other) with no lost detail.
If you are someone that wants to try processing a set of your own images, you probably should contact me. Currently the tool chain expects a CSV file with one line per image that gives the image name, the lon, lat, alt, as well as the roll, pitch, yaw of the aircraft at the time the image was taken. We are setup to do this easily with our own in-house autopilot and camera system, but we might need to build a small bit of glue code to create this file for images collected on other systems.
I'm posting here because I'd love to get some feed back, comments, questions, or maybe just confused looks? If there are a few brave souls interested in trying out the software that would also be cool. I'd love to connect up with other people interested in the nuts and bolts of image stitching tool chains. I really haven't any places where people are talking shop so to speak. Most people are either so far out ahead of me I can't understand what they are talking about, or they are doing this commercially and need to protect their own interests. I just wanted to say hi (so "Hi!") and say here's a thing I've been working on which is useful for us, so might be useful for someone else too?
Thanks,
Curt (U of MN UAS Lab)