

You are using an out of date browser. It may not display this or other websites correctly.
You should upgrade or use an alternative browser.
You should upgrade or use an alternative browser.
Drone Deploy/mapping tips
- Thread starter Recoveryone
- Start date

And this is the note at the end of the "New Features" demonstration:
Terrain Awareness is available to all customers. Inspection, Multispectral, and Shapefile Overlays are only available for Business + Enterprise customers. And the Compliance and Equipment Reports are Enterprise Platinum only. Contact sales to learn more about our enterprise offerings.
Terrain Awareness is available to all customers. Inspection, Multispectral, and Shapefile Overlays are only available for Business + Enterprise customers. And the Compliance and Equipment Reports are Enterprise Platinum only. Contact sales to learn more about our enterprise offerings.

adm_geomatics
Well-Known Member
- Joined
- Nov 30, 2019
- Messages
- 546
- Reaction score
- 290
- Age
- 51
- Location
- Leander, Texas
- Website
- www.admgeomatics.com
Ahha! There's a bummer. I think this should at least be an add-on, but I understand why solutions providers don't do a la carte.And this is the note at the end of the "New Features" demonstration:
Terrain Awareness is available to all customers. Inspection, Multispectral, and Shapefile Overlays are only available for Business + Enterprise customers. And the Compliance and Equipment Reports are Enterprise Platinum only. Contact sales to learn more about our enterprise offerings.
I had success with it twice now, but have not had a flight with more than a 50ft elevation change. One of them was a cliff, but I should be able to get a 150-200ft range in the next day or so. Fingers crossed!
I take it that your using an IOS device?
adm_geomatics
Well-Known Member
- Joined
- Nov 30, 2019
- Messages
- 546
- Reaction score
- 290
- Age
- 51
- Location
- Leander, Texas
- Website
- www.admgeomatics.com
Yes, I just moved to a 7th Gen 10.2 iPad. It barely fits in the Phantom RC.I take it that your using an IOS device?
Ahha! There's a bummer. I think this should at least be an add-on, but I understand why solutions providers don't do a la carte.
Terrain Awareness is available to all customers regardless of the plan level The "other" options are plan dependent.
adm_geomatics
Well-Known Member
- Joined
- Nov 30, 2019
- Messages
- 546
- Reaction score
- 290
- Age
- 51
- Location
- Leander, Texas
- Website
- www.admgeomatics.com
Here's what I got so far. I asked a few more questions and will follow up.
We currently use mapbox terrain elevation tiles, which are a mix of multiple sources and recency:
The global base map is NASA JPL SRTM data and has 16 m RMSE at 90% confidence
However, in the USA and Europe the grid is enhanced to 5m spacing and 1m RMSE
In Finland, Norway and the UK it can be higher accuracy, with 1.6m grid.
Vertical elevation is reported at ~0.1m precision (but as you can see the accuracy will be lower than that).
We sample the flight path at regular intervals along each leg, then optimize the waypoints to remove any on the flat or in areas of constant grade.
R Martin
Well-Known Member
We use a customized Ardupilot software for mission planning and flight control and the manual includes the following:
"WARNING: Terrain Awareness is only a feature of the Map Tool, for the purpose of planning your missions only. It is not a real time terrain collision avoidance feature "
"WARNING: SRTM terrain data is generally reliable between latitudes of 56˚S and 50˚N, but in ~0.2% of the surveyed area there can be voids in the data, or void-filled areas that do not match well with reality. This is common in areas of high relief (summits, ridges, canyons, gorges, etc). It’s critical that you check your mission plan against available terrain sources, including your own understanding of the area! We have included a KML output feature for this purpose, details below. "
While using the feature I have experienced our base minimums of 0.5in/px GSD or better from our pre programmed flight altitude without encountering any anomalies but this is north central Texas and relatively flat is the order of the day.
adm_geomatics
Well-Known Member
- Joined
- Nov 30, 2019
- Messages
- 546
- Reaction score
- 290
- Age
- 51
- Location
- Leander, Texas
- Website
- www.admgeomatics.com
Sounds like you have it under control. Those disclaimers is why DroneDeploy is using multiple sources for their surface so that they can cover more of the globe, not just specific areas like ArduPilot. Anyone who is using Terrain Awareness should know that these are more like a DTM so obviously they are not going to include buildings, towers or even trees unless they are in a very dense condition. The NASA SRTM is cleaned so it does a pretty good job of even that condition.We use a customized Ardupilot software for mission planning and flight control and the manual includes the following:
"WARNING: Terrain Awareness is only a feature of the Map Tool, for the purpose of planning your missions only. It is not a real time terrain collision avoidance feature "
"WARNING: SRTM terrain data is generally reliable between latitudes of 56˚S and 50˚N, but in ~0.2% of the surveyed area there can be voids in the data, or void-filled areas that do not match well with reality. This is common in areas of high relief (summits, ridges, canyons, gorges, etc). It’s critical that you check your mission plan against available terrain sources, including your own understanding of the area! We have included a KML output feature for this purpose, details below. "
While using the feature I have experienced our base minimums of 0.5in/px GSD or better from our pre programmed flight altitude without encountering any anomalies but this is north central Texas and relatively flat is the order of the day.
R Martin
Well-Known Member
We operate at the upper limit or our altitude band; usually with a base of 330 feet AGL. It is definitely something I would not use below 200 feet in this area.Sounds like you have it under control. Those disclaimers is why DroneDeploy is using multiple sources for their surface so that they can cover more of the globe, not just specific areas like ArduPilot. Anyone who is using Terrain Awareness should know that these are more like a DTM so obviously they are not going to include buildings, towers or even trees unless they are in a very dense condition. The NASA SRTM is cleaned so it does a pretty good job of even that condition.
adm_geomatics
Well-Known Member
- Joined
- Nov 30, 2019
- Messages
- 546
- Reaction score
- 290
- Age
- 51
- Location
- Leander, Texas
- Website
- www.admgeomatics.com
Seems like 200ft would be plenty above a TA surface, but you know your area and provider better than I do so kudos keeping safety first priority.We operate at the upper limit or our altitude band; usually with a base of 330 feet AGL. It is definitely something I would not use below 200 feet in this area.
adm_geomatics
Well-Known Member
- Joined
- Nov 30, 2019
- Messages
- 546
- Reaction score
- 290
- Age
- 51
- Location
- Leander, Texas
- Website
- www.admgeomatics.com
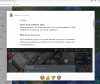
Here's the initial look at the input data. Due to the snow on the ground everything is pretty well under-exposed. I will fix that in the second run.
Image Layout, obviously there's a hole.

DroneDeploy threw this warning. Initial look seems ok in Geosetter.

There's also some strange pitch, yaw and roll values, but I went ahead and started the upload and will look at all this later.
Image Layout, obviously there's a hole.
DroneDeploy threw this warning. Initial look seems ok in Geosetter.
There's also some strange pitch, yaw and roll values, but I went ahead and started the upload and will look at all this later.
clolsonus
Well-Known Member
- Joined
- Feb 22, 2019
- Messages
- 229
- Reaction score
- 148
- Age
- 57
Here's the initial look at the input data. Due to the snow on the ground everything is pretty well under-exposed. I will fix that in the second run.
Image Layout, obviously there's a hole.
View attachment 2084
Yes, flying with the drone deploy planning app on an android phone, I have often been getting big gaps where I switch batteries. The app doesn't resume exactly where it left off (usually I get some lost areas, but once in a while I get extra overlap ...) I do not see this issue with our phantom 4 pro flying with an ipad (but the ipad is too big for the mavic 2 controller/cable so I fly the mavic 2 with my android phone.)
DroneDeploy threw this warning. Initial look seems ok in Geosetter.
View attachment 2085
I don't know where that message would be coming from. I was flying with a mavic 2 pro at a fixed altitude for the entire area. This area does have significant surface variation so maybe DD was looking at the SRTM surface data when generating this message? I was flying from the highest open spot I could get access to, but the terrain was rising quite a bit more in many places. The highest point is on the far east side at the top of the bluff. I was staging the flights closer to the western edge of the area in an open farm field. (You can probably find us and our makeshift cardboard box landing pad.)
I anticipate drone deploy will not be able to stitch quite a few of the images in places where the terrain is the highest. The general advice for that is to fly higher or with more overlap. However, I was maxed out at 390' above my launch point so I couldn't go higher (this flown before drone deploy added terrain awareness I think.) Plus mix in the other constraints of needing to hike into the state park and find an open/visible place to fly from ... I ran into a lot of challenging constraints. So this flight plan was my best attempt to juggle all the different factors and collect data we can use successfully for our project.
Background: the area we covered is an area the MN DNR is planning to focus on this spring to go through and work on eradicating oriental bittersweet. So we were doing our best to cover that target area and help them locate infestations ahead of time. Getting access to the top of the bluff would have involved dragging our gear on a several mile hike through snow without trails much of the way, so in the end we compromised and did a shorter hike to the farm field at the bottom of the bluffs and flew bottom up instead of top down.
This is us:
.jpg")
There's also some strange pitch, yaw and roll values, but I went ahead and started the upload and will look at all this later.
I also don't know what that would be about. These are images straight off the mavic 2 unaltered.
If anyone else out there in CDP land is interested in looking at this dataset (from a windows machine.) I have packaged up my map explorer tool as a zip file. You would just unzip the download and the self contained app is inside ... no need to install anything outside of unzip the download file. Then download the dataset mentioned earlier in this thread (19Gb) and you can happily poke around and see all the original images with full detail placed in their correct locations.
My entire tool chain is open-source (MIT license) and written mostly in python + opencv (+ numpy, scipy, panda3d, et al.) If anyone wants to poke around under the hood or look into processing their own datasets in a similar way, everything is here:
GitHub - NorthStarUAS/ImageAnalysis: Aerial imagery analysis, processing, and presentation scripts.
Aerial imagery analysis, processing, and presentation scripts. - NorthStarUAS/ImageAnalysis
 github.com
Thanks,
Curt.
adm_geomatics
Well-Known Member
- Joined
- Nov 30, 2019
- Messages
- 546
- Reaction score
- 290
- Age
- 51
- Location
- Leander, Texas
- Website
- www.admgeomatics.com
Ok, Mavic 2 Pro and Android explains all that except for the variance in altitude. I went through with EXIF tool and saw no more than 9 meters in variance, which is still quite a lot even for an M2P. Running Android answered my next question - No terrain awareness? I think running the P4P, half a crosshatch mission and terrain awareness would help this dataset allot. This would allow you to confidently fly closer to the ground and the oblique images would probably be more beneficial to your cause than the map.Yes, flying with the drone deploy planning app on an android phone, I have often been getting big gaps where I switch batteries. The app doesn't resume exactly where it left off (usually I get some lost areas, but once in a while I get extra overlap ...) I do not see this issue with our phantom 4 pro flying with an ipad (but the ipad is too big for the mavic 2 controller/cable so I fly the mavic 2 with my android phone.)
I don't know where that message would be coming from. I was flying with a mavic 2 pro at a fixed altitude for the entire area. This area does have significant surface variation so maybe DD was looking at the SRTM surface data when generating this message? I was flying from the highest open spot I could get access to, but the terrain was rising quite a bit more in many places. The highest point is on the far east side at the top of the bluff. I was staging the flights closer to the western edge of the area in an open farm field. (You can probably find us and our makeshift cardboard box landing pad.)
I anticipate drone deploy will not be able to stitch quite a few of the images in places where the terrain is the highest. The general advice for that is to fly higher or with more overlap. However, I was maxed out at 390' above my launch point so I couldn't go higher (this flown before drone deploy added terrain awareness I think.) Plus mix in the other constraints of needing to hike into the state park and find an open/visible place to fly from ... I ran into a lot of challenging constraints. So this flight plan was my best attempt to juggle all the different factors and collect data we can use successfully for our project.
Background: the area we covered is an area the MN DNR is planning to focus on this spring to go through and work on eradicating oriental bittersweet. So we were doing our best to cover that target area and help them locate infestations ahead of time. Getting access to the top of the bluff would have involved dragging our gear on a several mile hike through snow without trails much of the way, so in the end we compromised and did a shorter hike to the farm field at the bottom of the bluffs and flew bottom up instead of top down.
This is us:
View attachment 2088
I also don't know what that would be about. These are images straight off the mavic 2 unaltered.
If anyone else out there in CDP land is interested in looking at this dataset (from a windows machine.) I have packaged up my map explorer tool as a zip file. You would just unzip the download and the self contained app is inside ... no need to install anything outside of unzip the download file. Then download the dataset mentioned earlier in this thread (19Gb) and you can happily poke around and see all the original images with full detail placed in their correct locations.
My entire tool chain is open-source (MIT license) and written mostly in python + opencv (+ numpy, scipy, panda3d, et al.) If anyone wants to poke around under the hood or look into processing their own datasets in a similar way, everything is here:

GitHub - NorthStarUAS/ImageAnalysis: Aerial imagery analysis, processing, and presentation scripts.
Aerial imagery analysis, processing, and presentation scripts. - NorthStarUAS/ImageAnalysis
Thanks,
Curt.
The images uploaded last night so we should have the map this afternoon. I am post-processing the images in ACDSee now for the second run.
*Update: The inconsistent altitude message was just two images in the middle of the set that were the DroneDeploy checkshots. This is actually a fairly new message and will be interesting to see how it works in coordination with the release of terrain awareness.
Last edited:
Dave Pitman
Well-Known Member
re: terrain awareness.
Not trying to steal DD's thunder, but if you really want Terrain Awareness, you probably should look into Map Pilot.
Map Pilot has had terrain awareness for some years now. It is a paid app vs. DD flight, and only ios. But it is fully mature and is probably where DD is trying to get to.

 support.dronesmadeeasy.com
support.dronesmadeeasy.com
Not trying to steal DD's thunder, but if you really want Terrain Awareness, you probably should look into Map Pilot.
Map Pilot has had terrain awareness for some years now. It is a paid app vs. DD flight, and only ios. But it is fully mature and is probably where DD is trying to get to.
- Map Pilot's SRTM tiles are downloaded and do not require a live connection in the field.
- In addition to SRTM, you can use your own created DTM to provide a very accurate terrain aware flight if needed.
Terrain Awareness
The world is not flat. As of Map Pilot 2.1.0, the ability for the app to download terrain data for adjusting flight plans according to the terrain under them is available as an In-App Purchase. Pu...
support.dronesmadeeasy.com
Custom Terrain Source for Terrain Awareness
For most flights, the SRTM data is good enough. But for when the flight needs to be super low or the terrain has cliffs, steep slopes, or structures it may help to have some more resolution. To han...
support.dronesmadeeasy.com
adm_geomatics
Well-Known Member
- Joined
- Nov 30, 2019
- Messages
- 546
- Reaction score
- 290
- Age
- 51
- Location
- Leander, Texas
- Website
- www.admgeomatics.com
@clolsonus Sending you a PM with a link to download all the DroneDeploy data. It also includes the photos after my ACDSee post-processing and the resulting point cloud, but all the other data is straight off your images. While post-processing the photos did increase the point cloud count by about 3% the cloud itself was not successful. Would it be ok for me to engage DroneDeploy to take a look at it for test data and possibly get the full point cloud?
Base Images

ACDSee Images

Base Images
ACDSee Images
adm_geomatics
Well-Known Member
- Joined
- Nov 30, 2019
- Messages
- 546
- Reaction score
- 290
- Age
- 51
- Location
- Leander, Texas
- Website
- www.admgeomatics.com
This would actually be a good representation of why I have been speaking with DroneDeploy about decreasing their decimation of the point clouds that we are allowed to download. The available "max" is not max. The machine obviously has more data than they are letting us download otherwise they wouldn't have been able to produce this elevation profile.


...and recovering data with image post-processing.
...and recovering data with image post-processing.
Last edited:
clolsonus
Well-Known Member
- Joined
- Feb 22, 2019
- Messages
- 229
- Reaction score
- 148
- Age
- 57
Hi Chasco,
Thanks again for running my images through the DD tool chain! I really appreciate that. A couple comments in reply:
1. If you would like to share this data set with drone deploy to see if there are tweaks or things that could help them improve their results, that would be great. The area is a state park so there aren't any privacy or ownership issues with the images as far as I am aware.
2. The earlier link I posted to the images is still valid so if anyone else is interested enough in this thread to download them and process the images with other tools, I would love to see the results of that as well. For me it is really interesting to compare and contrast different results, but I don't have the resources to test all the tools out there. I think there are at least dozens of reasonable choices out there for doing image stitching and mapping.
3. I don't know anything about the internals of drone deploy, but I do know that typically: feature detector algorithms work on the gray scale version of the image and react to relative changes in pixel intensity. So I would anticipate that running a preprocessing step to tweak the color map or lighting would affect the results maybe a little, but maybe not as much as you would hope. One thing I will do is chop the image scale down to 50% or 25%. The reason is that this acts much like a noise filter and allows the feature detector to react better to real features in the image rather than potential sensor noise ... but this is one of those things that really depends on the context, the camera, the subject matter, the conditions, etc. The amount of scaling (if any) that helps the tool chain perform better really depends on the data set. Notice that scaling an image down to a smaller size yields some of the same benefits of flying at a higher altitude (sort of, partially ...)
4. I can speak to the holes in the point cloud. If you overlay the point cloud on top of the elevation model, you'll notice that the big gaps are in the areas of higher elevation + heavy forest. (Higher elevation and bare ground worked fine.) Why is this? First, if the whole area is flown at a fixed altitude, then the areas of higher terrain elevation will have less overlap and greater perspective change, and areas of lower elevation will have more overlap and less perspective change. Less overlap == harder to find good feature matches. Second, this is a forested area with steep terrain. This means that many of the features in image "A" will be parts of trees and branches as they intersect with each other and the ground. Move over 10-20 meters and now look at image "B". Even though the two images could have a lot of overlap, many of the features that are parts of trees and intersections between branches and shadows are now totally different features in image B. So you have this situation where many (most?) of the features aren't even the same feature in the overlapping image, you can't see much of the ground (or it's all white featureless snow), and combine this with areas of higher terrain with less overlap and more perspective change from one image to the neighbor image. It ends up being an almost insurmountable problem for a map stitching tool.
5. There is a related issue if you image a healthy corn field at low altitude, even when you get great 70-80% overlap. Imagine *all* the features in the entire image are parts of corn leaves or intersections of corn leaves. Imagine trying to match this up with the features of the neighbor image -- so many of the features are similar, or repeated, now add a 10-15 mph wind blowing the corn leaves around so they aren't even in the same places in the neighbor images. There is a "signal" in there somewhere, but the amount of noise is overwhelming and the stitching tools just can't find the true pattern of matches to make a fit. What's worse is that I can look at the pictures with my human eye and even when I know approximately how they go together, I still can't visually see the fit myself ... so if it's hard for our incredible amazing human to see the pattern, it's often way harder for a computer to figure it out with math tricks.
6. Sorry if I'm already way off into deep technical-ese here ... it's about to get worse!
What I have done in my own tool chain to improve the stitching process is this.

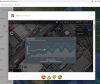
Since we've also been talking about surface elevation as well ... it is another import piece of information needed to predict which features in image A should be plausible matches with image B, here is the SRTM surface elevation vs. my estimate of the surface elevation below each image in the "big circle area" data set we are looking at. You can see there is pretty good agreement in the larger trends, but lots of differences at each individual point:

Thanks again for running my images through the DD tool chain! I really appreciate that. A couple comments in reply:
1. If you would like to share this data set with drone deploy to see if there are tweaks or things that could help them improve their results, that would be great. The area is a state park so there aren't any privacy or ownership issues with the images as far as I am aware.
2. The earlier link I posted to the images is still valid so if anyone else is interested enough in this thread to download them and process the images with other tools, I would love to see the results of that as well. For me it is really interesting to compare and contrast different results, but I don't have the resources to test all the tools out there. I think there are at least dozens of reasonable choices out there for doing image stitching and mapping.
3. I don't know anything about the internals of drone deploy, but I do know that typically: feature detector algorithms work on the gray scale version of the image and react to relative changes in pixel intensity. So I would anticipate that running a preprocessing step to tweak the color map or lighting would affect the results maybe a little, but maybe not as much as you would hope. One thing I will do is chop the image scale down to 50% or 25%. The reason is that this acts much like a noise filter and allows the feature detector to react better to real features in the image rather than potential sensor noise ... but this is one of those things that really depends on the context, the camera, the subject matter, the conditions, etc. The amount of scaling (if any) that helps the tool chain perform better really depends on the data set. Notice that scaling an image down to a smaller size yields some of the same benefits of flying at a higher altitude (sort of, partially ...)
4. I can speak to the holes in the point cloud. If you overlay the point cloud on top of the elevation model, you'll notice that the big gaps are in the areas of higher elevation + heavy forest. (Higher elevation and bare ground worked fine.) Why is this? First, if the whole area is flown at a fixed altitude, then the areas of higher terrain elevation will have less overlap and greater perspective change, and areas of lower elevation will have more overlap and less perspective change. Less overlap == harder to find good feature matches. Second, this is a forested area with steep terrain. This means that many of the features in image "A" will be parts of trees and branches as they intersect with each other and the ground. Move over 10-20 meters and now look at image "B". Even though the two images could have a lot of overlap, many of the features that are parts of trees and intersections between branches and shadows are now totally different features in image B. So you have this situation where many (most?) of the features aren't even the same feature in the overlapping image, you can't see much of the ground (or it's all white featureless snow), and combine this with areas of higher terrain with less overlap and more perspective change from one image to the neighbor image. It ends up being an almost insurmountable problem for a map stitching tool.
5. There is a related issue if you image a healthy corn field at low altitude, even when you get great 70-80% overlap. Imagine *all* the features in the entire image are parts of corn leaves or intersections of corn leaves. Imagine trying to match this up with the features of the neighbor image -- so many of the features are similar, or repeated, now add a 10-15 mph wind blowing the corn leaves around so they aren't even in the same places in the neighbor images. There is a "signal" in there somewhere, but the amount of noise is overwhelming and the stitching tools just can't find the true pattern of matches to make a fit. What's worse is that I can look at the pictures with my human eye and even when I know approximately how they go together, I still can't visually see the fit myself ... so if it's hard for our incredible amazing human to see the pattern, it's often way harder for a computer to figure it out with math tricks.
6. Sorry if I'm already way off into deep technical-ese here ... it's about to get worse!
What I have done in my own tool chain to improve the stitching process is this.
- I know the approximate location and orientation of the photo from the DJI xmp image meta data.
- I can estimate the surface elevation using SRTM (or using simple feature triangulation as I start to find matches between image pairs.)
- I can estimate the yaw error of the DJI drone as I begin to match pairs of images. Note this can range as far as +/- 20 degrees for a single mission!
- With that info I can often predict where the matches will be between a pair if images "A" and "B". I project a grid from image "B" onto my surface estimate, and then reproject that grid back into the pixel space of image "A". I can use that to derive a homography matrix between the pair of images. Then, all the true matches in the pair should approximiately honor that homography relationship. Matches that are too far away are impossible and I can immediately throw them out. From there the small amount of "signal" can begin to show through the shrinking sea of "noise". This process isn't perfect, but it allows me to find a lot more pair matches and build a point cloud with much better coverage than pix4d. The cost is that it is computationally harder and slower and processing takes a lot longer. So it's a trade off ... fast and easy (go with pix4d or drone deploy or something similar.) But if you are trying to extract the most out of your data set, it might be worth spending the extra time and doing the extra processing work ... but again, totally dependent on each of our own use-cases.
")
Since we've also been talking about surface elevation as well ... it is another import piece of information needed to predict which features in image A should be plausible matches with image B, here is the SRTM surface elevation vs. my estimate of the surface elevation below each image in the "big circle area" data set we are looking at. You can see there is pretty good agreement in the larger trends, but lots of differences at each individual point:
Last edited:
clolsonus
Well-Known Member
- Joined
- Feb 22, 2019
- Messages
- 229
- Reaction score
- 148
- Age
- 57
This would actually be a good representation of why I have been speaking with DroneDeploy about decreasing their decimation of the point clouds that we are allowed to download. The available "max" is not max. The machine obviously has more data than they are letting us download otherwise they wouldn't have been able to produce this elevation profile.
View attachment 2093 View attachment 2094
That was one of the reasons that led me down the path of working on my own mapping tool chain. For our project's use case we needed *max* detail. I am constantly being pressured to fly lower, fly lower, fly lower, get more detail! Yet they simultaneously want to cover larger and larger areas, and venture into regions with crazy terrain and tall trees. So when we got some of our early map results back and discovered the detail had been reduced (even in the online map) we were substantially disappointed. Further, when we tried to download the geotiff and discovered it wouldn't allow us to do that until we cut the resolution down by a further 8x, we realized it was just a no-go for our project. Pix4d does even worse (in my own experiences comparing results with my own data sets.)
Our in-house tools serve our own specific use case where we literally draw the original images out in a big pile (after we've carefully computed their placement, warping, and alignment using a process similar to what the big companies use.) This gives us a 'perfect' stitch and simultaneously gives us *all* the original max resolution of our images. And as a bonus we can flip around between all the images and perspectives that cover a point of interest ... all live on our stitched ortho map. For us it adds dimension and detail to our maps that a static orthophoto or dense point cloud really can't do.
This doesn't seem to be a use case that any of the expensive tools have considered or covered. And maybe it's not very common to want to hunt through the finest/pickiest details of your image sets, but it is what we need to do for our projects (looking for invasive plants in hard to reach forest areas.)
Anyway, I agree it is curious that DD could generate a plausible elevation map and plausible ortho mosaic that covers the entire data set, while seemingly not having the underlying point cloud to support that. Perhaps there is a threshold of confidence required for the 3d point cloud and those areas just didn't quite make the cut.
Thanks again for running my data set and sharing the results! This stuff is super interesting and fascinating (at least to me!)
Curt.


New Posts
-
Looking for feedback from commercial operators on our drone comparison tool
- Latest: AlexisFraNorge
-
For sale: LiDAR + M300 Package — $17,700 Entry-Level Turnkey System
- Latest: DronesonDemand
-
DJI Mavic 3 Enterprise (M3E Wide) + RTK + DJI RC Pro Enterprise + 7 Low-Cycle Batteries + Rapid Charger
- Latest: David Oakes - SkyData
-
Rethinking how we deliver drone jobs - looking for feedback
- Latest: MainelyDrones
-